Data Desk - 生物统计软件
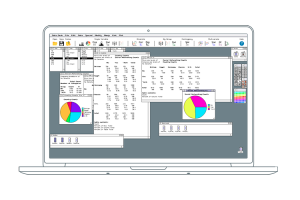
Data Desk是Data Description公司开发的生物统计软件,易于使用的数据分析软件包,自1986年以来一直帮助人们了解他们的数据。该程序提供了基于探索性数据分析的概念和理念的分析和显示的交互式工具。Data Desk是实现了适用于计划实验和调查数据的传统统计技术。然而,该计划的真正优势在于其的数据探索,可视化和挖掘工具。Data Desk中的图表和表格都链接在一起,以便在显示中选择的点在显示中突出显示。选择条形图或直方图中的条形图,饼图的切片,表格的行,列或单元格,或散点图中的点,旋转图,点图或箱线图,并在图中突出显示所选点。
Data Desk是部分探索和部分直觉。随着数据集的不断增长,图形化实时数据分析变得有用。Data Desk是经过时间考验的工业,研究和教育工具。它提供了解人数据所需的工具,还提供了理解统计数据的方法。凭借文档和数据可视化的多年发展。

Data Desk实施了传统的统计技术,适用于计划的实验和样本调查中的数据。该程序的真正优势在于其的数据探索工具。这些工具简化了数据的直观检查,图形显示统计学方面的培训。使用Data Desk探索数据时,您会发现模式和关系。但是,你还将发现不适合的元素—这通常是您可以发现的有关数据的有效发现。
使探索性数据分析为您工作意味着以多种相关方式显示数据。这意味着计算速度足够快,可以在您可能期望花费在单个分析上的时间内尝试进行多种替代分析。这意味着将数据中的视图链接在一起,以更深入的了解数据中的描述,关系和异常。
Data Desk的界面设计得。直接用鼠标修改图和表格。通过拖放或更改变量。图形和表格存储在图标中,以便可以可以打开和修改。
大量数据存储在Microsoft Excel等电子表格程序中。Data Desk附带有Excel加载项,该加载项将数据直接从Excel移动到Data Desk。创建和打开ASCII文件的麻烦即可移动数据。
Data Desk可以处理大型文件—10,000个数据点,100,000个数据点,一百万个数据点。Data Desk的可视化工具可对数据集进行的探索。

Data Desk的更新,适用于带来功能的Data Desk 8用户。
● XLSX导入通过Data Desk分析将您的日常数据带入视野。自动导入关系,并使用导入向导命名变量。
● 新的更新检查可让您及时了解新的错误修复和增强功能。这将在更频繁和渐进的基础上提供更新的功能。
● DASL可以在带注释的数据和故事库中即时访问Data Desk。浏览与基于Web的搜索引擎中的统计方法或常规主题相关的 数据文件,然后单击一次即可在Data Desk中查看相同的数据。
以新的方式看待事物
通过允许用户以不同方式重新表达数据,Data Desk鼓励实验和组合创建更具吸引力的模型。实时选择不同可视化中的数据并对其进行分类。
获得更多的视角
现实的数据难以使用。除了微道的案例之外,盲目的将公式应用于应用于数据几乎没有价值。Data Desk允许人们退后一步并浏览数据。比以往更快的发现异常值和趋势。

你的饼图和图表也是如此
多年的工程设计使Data Desk成为同类速度和拖放性之间的选择。使用我们的引擎,大数据集无法理解。

Data Desk provides interactive graphical tools for exploring and understanding your data, for finding the patterns, relationships, and exceptions.
While Data Desk implements many traditional statistics techniques suitable for data from planned experiments and sample surveys, its true strength is its powerful tools for data exploration. Its insightful graphic displays simplify intuitive investigation of your data.
You Do Need a Statistics Background
If you're using Data Desk, no special training in statistics is necessary to gain insight on the implications of the data you need to understand. You find patterns and relationships and you l bring to light the elements that don抰 fit -- the most important discoveries you can make. You l get to the real causes behind the patterns and relationships.
See Your Data Many Ways at Once
Extreme computational speed and linked views make Data Desk an unsurpassable tool for exploring any set of data. From a few hundred cases to a few million, you抣l see several different views of your data at once. Select points in one plot or table and see those points highlight instantly in all other plots. Modify a data value or parameter and see all relevant plots and table update immediately. Start at one level and drill down for more detailed views.
- 2026-02-09
- 2026-01-20
- 2026-01-16
- 2026-01-12
- 2026-01-12
- 2026-01-09
- 2026-02-05
- 2026-02-05
- 2026-01-28
- 2026-01-26
- 2026-01-26
- 2026-01-16


