

NVivo 12 - 定性(质性)分析软件
当前版本已更新为NVivo15。
什么是NVivo?

我们的生活正在随着数据 - 文本,视频,社交媒体等爆炸式的增长。没有正确的研究工具来理解它就像是在大海捞针。
NVivo概述。
NVivo 12 是定性和混合方式搜索的软件, 它是为了帮助您整理、分析和找到对非结构化或定性数据(例如:采访、开放式调查回答、文章、社交媒体和网页内容)的深刻见解而设计的。护理,公共健康,心理学,教育等研究人员处理定性数据时,NVivo软件是合适的选择。若不使用NVivo,研究人员的工作会耗费时间,难以管理,且难以发现数据中的联系,并找到能够为大家提供优势的新见解。
借助NVivo 12,您可以做些什么?
• 使用文本、音频、视频、图像、电子表格、在线调查、社交媒体和网上内容。
• 使用强的查询工具。
• 创建项目和概念图,展示数据中的关联。
• 使用NCapture快速抓取社交媒体内容用于分析。
NVivo 12 for Windows
NVivo 12 for Windows是合适的定性数据分析软件。目前,它提供两个版本:
NVivo 12 Pro for Windows: 广泛用于数据分析和更为复杂的分析。
NVivo 12 Plus for Windows: 可以快速地得出调查结果和对网络进行分析。
NVivo for Teams
将NVivo 12 for Windows的分析工具与NVivo for Teams相结合,体验精简化的安全研究合作。
NVivo 12 for Teams适合各种规模的团队,是拥有更大数据量的复杂研究项目的解决方法。 通过NVivo 12 for Teams,您的团队将能够更快速地制定精明的决策。 目前,它提供英文用户界面。
NVivo 12 for Mac
NVivo 12 for Mac是由Mac开发者为Mac用户创建的,是原生定性数据分析Mac应用。如果您是一名Mac用户,需要获得对定性数据的深刻见解,请尝试NVivo for Mac,这是一款对Mac用户的功能丰富的定性数据分析软件,提供英语用户界面。
广泛的数据
NVivo支持几乎任意格式的导入、管理和数据分析,包括文本、图像、视频、音频、电子邮件、表格、在线调查、网络和社交媒体数据。NVivo是可以让用户以丰富的数据集的形式从Facebook,Twitter和YouTube收集数据,以便可以访问评论,人口统计和位置等数据。

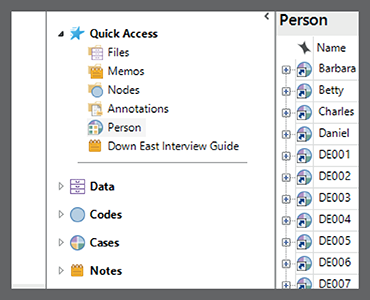
自动组织有序的数据
在导航视图中固定常用的文件夹和项目,以便快速的找到内容。将用户的想法存储在备忘录中,以获得更快、更透明和可靠的报告。在工作时使用注释功能来记录信息来源,这样用户就不会丢失以后可能想要探索的想法。
严格地分析数据
使用交叉表通过一个或两个属性(如年龄或职业)来分析主题,或通过增强混合方法研究的案例来分析主题。根据人口统计数据等属性构建查询。与SPSS交换数据以进行进一步的统计分析。

查询你的数据
在导航视图中固定常用的文件夹和项目,以便快速的找到内容。将用户的想法存储在备忘录中,以获得更快、更透明和可靠的报告。在工作时使用注释功能来记录信息来源,这样用户就不会丢失以后可能想要探索的想法。
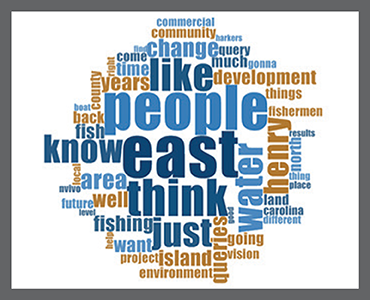
可视化你的研究
以可视化形式展示你的数据,如图表、思维导图、词云、探索、比较图表等等。当你准备好分享你的调查结果时,可以将可视化结果导出到报告和演示文稿中。
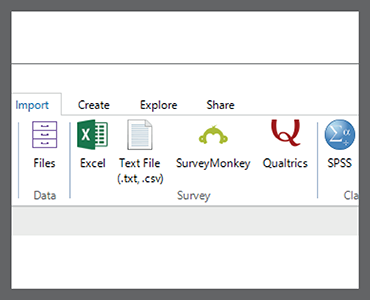
导入并共享你的数据
将SurveyMonkey和Qualtrics调查直接导入NVivo中。从Microsoft Excel,IBM SPSS Statistics和参考管理软件中导入和共享信息。从Evernote和OneNote中随时随地导入收集的记录。
以下功能只适用于NVivo Plus
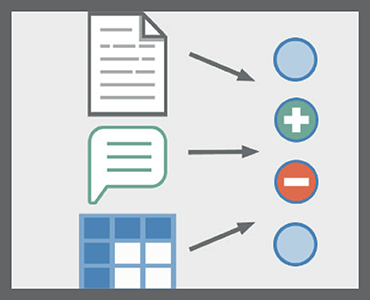
自动编码
在几分钟内自动将大量文本中的信息(如主题或正面和负面的情绪)分组,从而节省时间。在项目开始时形成初步结果,或在工作时验证你的想法。教NVivo如何使用基于模式的自动编码对数据进行编码,以自动对数据进行分类。
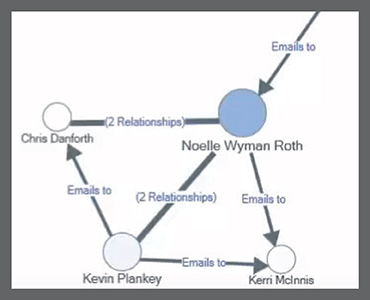
分析社交网络
发现有影响力的人和舆论导向者,并使用社交网络分析来研究信息流。自动创建社交可视化信息图以查看网络关系和相互作用,并使用指标来发现关键网络作用的角色。查看谁回复了推文,谁转发了推文。
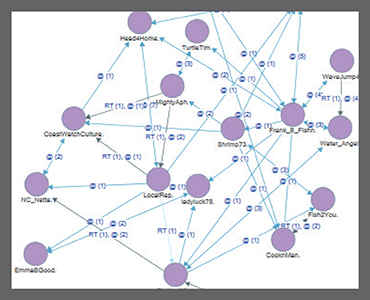
增强数据可视化
想象的中心人如何与人相连,以及这些人如何以自我中心的社会关系相互联系。看到一群人与网络社会关系之间的联系或缺乏联系。并将Twitter数据集可视化,以查看Twitter用户的网络以及他们与社交媒体社交图的关系。
【英文介绍】
Store and organize
Store and sort all your data in one platform, from quantifiable demographic information to qualitative open-ended questions and interviews.
Categorize and analyze
Use powerful tools to categorize and classify your data. Automatically sort sentiment, themes and attributes in seconds. Quickly exchange data with SPSS for further statistical analysis.
Visualize and discover
Easily cross tabulate mixed methods data and visualize the results to brainstorm and map ideas, explore connections between project items and discover new paths of investigation.
Purpose-built for qualitative and mixed-methods research
The last decade has seen a revolution in the ease of accessing digital data, from social media to digitalized libraries, big data, bio-data and more. While collecting data has never been easier, the bigger challenge is bringing it all together in a meaningful way. With data spread across so many different formats, finding connections can be extremely difficult and time consuming without the right tools.
NVivo gives you a place to organize, store and retrieve your data so you can work more efficiently, save time and rigorously back up findings with evidence. Import data from virtually any source – text, audio, video, emails, images, spreadsheets, online surveys, social and web content and more. With advanced data management, query and visualization tools, NVivo lets you ask complex questions of your data so you can discover more.
Easy to learn and use
Only see tabs and commands when you need them using our redesigned navigation toolbar. Easily group project items according to research tasks using the Navigation View. Thanks to a streamlined layout, classifying your data and working with cases has never been easier.
Organize information automatically
Pin your frequently used folders and items in navigation view for quick access to what you need. Store your thinking in memos for faster, more transparent and reliable reporting. Use annotations to make notes as you work so you don’t lose ideas you might want to explore later.
Enhance your mixed methods analysis
Use crosstabs to analyze themes by one or two attributes – like age or occupation – or by cases for enhanced mixed methods research. Totals are automatically calculated and the results can be saved as a SPSS file (.sav) for further statistical analysis.
Ask questions of your data
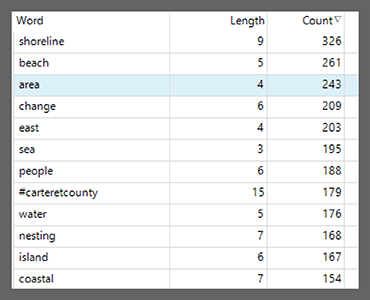
Use queries to ask complex questions and identify new meaning in your data. Test ideas, explore patterns and see connections between themes, topics, people and places. Look for emerging themes, find words and discover concepts using text search and word frequency queries.
Visualize your research
Visualize your data with the most comprehensive range of visualizations: charts, mind maps, word clouds, explore, comparison diagrams and many more. When you’re ready to share your findings, it’s easy to export your visualizations into reports and presentations.
Import and share your findings
Import SurveyMonkey and Qualtrics surveys directly into NVivo. Import and share information from Microsoft Excel, IBM SPSS Statistics and reference management software. Order transcripts from NVivo which then sync with your other data. Import notes collected on-the-go from Evernote and OneNote.
Only available in NVivo Plus
Automate coding
Save time by automatically grouping information such as themes and positive or negative sentiment from large volumes of text in minutes. Develop preliminary results at the start of a project, or validate your thinking as you work. Teach NVivo how to code your data using pattern-based auto coding to automatically categorize and classify data.
Analyze social networks
Discover influencers and opinion leaders and study the information flow using Social Network Analysis. Automatically create sociogram visualizations to see network relationships and interactions, and use metrics to discover critical network roles like influencers, connectors and brokers. See who’s tweeting and re-tweeting who.
Enhanced data visualization
Visualize how a particular central person is connected to other people, and how those people are connected to each other with egocentric sociograms. See the connections, or lack of connections between a group of people with network sociograms. And visualize Twitter datasets to see networks of Twitter users and how they are connected with social media sociograms.
Easy to learn and use
Only see tabs and commands when you need them using our redesigned navigation toolbar. Easily group project items according to research tasks using the Navigation View. See relationships in your data more clearly with classifications that intuitively link information about sources, people or places.
Keep everything in one place
Pin your frequently used folders and items in navigation view for quick access to what you need. Store your thinking in memos for faster, more transparent and reliable reporting. Use annotations to make notes as you work so you don’t lose ideas you might want to explore later.
Enhance your mixed methods analysis
Use crosstabs to analyze themes by one or two attributes – like age or occupation – or by cases for enhanced mixed methods research. Totals are automatically calculated and the results can be saved as a SPSS file (.sav) for further statistical analysis.
Ask questions of your data
Use queries to ask complex questions and identify new meaning in your data. Test ideas, explore patterns and see connections between themes, topics, people and places. Look for emerging themes, find words and discover concepts using text search and word frequency queries.
Visualize your research
Visualize and share your data with the most comprehensive range of visualizations: charts, mind maps, word clouds, explore, comparison diagrams and many more. Only in Plus, view egocentric, network and social media sociograms to chart inter-relationships within a group.
Import and share your findings
Import surveys and notes from SurveyMonkey, Qualtrics, Excel, Evernote and OneNote. Export items to easily share your data, analysis and findings. Share information with IBM SPSS Statistics for deeper analysis. Order transcripts from NVivo that sync with your other data.


- 2026-04-02
- 2026-03-27
- 2026-03-26
- 2026-03-26
- 2026-03-18
- 2026-03-12

- 2026-03-26
- 2026-03-11
- 2026-03-11
- 2026-03-11
- 2026-03-11
- 2026-03-11