


GlycanExplorer - 糖类分析软件
GlycanExplorer是一种高通量生物治疗性聚糖表征软件工具。配备in-silico片段和HRAM糖谱数据库,软件可以高精度识别可能的糖链结构。
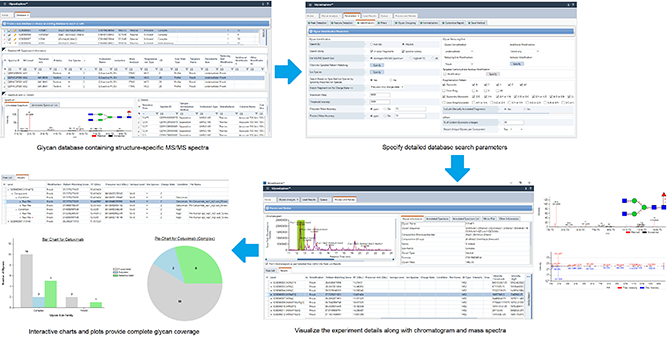
GlycanExplorer是用于生物治疗性聚糖表征和定量的一站式软件解决方案。借助预加载的高分辨率准确聚糖谱数据库,该软件可让您有信息识别可能的聚糖结构。广泛的数据组织以及交互式图表有助于实现聚糖样品的详细分析,这进一步有助于得出有意义的生物学理论。
GlycanExplorer主要功能:
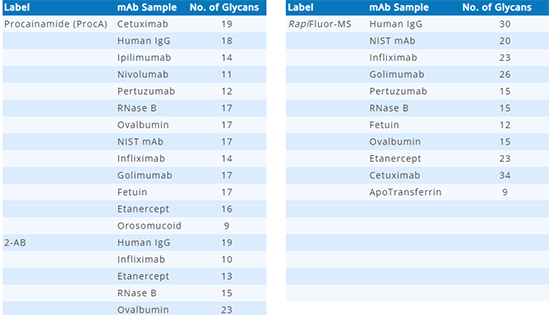
HRAM糖谱库
GlycanExplorer可容纳来自各种治疗性糖蛋白的内置HRAM糖谱库,这些糖蛋白用荧光团标记,例如2-氨基苯甲酰胺(2-AB)、Rapi Fluor-MS、普鲁卡因胺(ProcA)等。
该软件包含各种单克隆抗体(mAb)变体(Cetuximab, Ipilimumab, Infliximab, Pertuzumab, Golimumab, Nivolumab, and NIST mAb)和其他糖蛋白(例如Apotransferrin, Orosomucoid, Ovalbumin, RNaseB等)的光谱库。
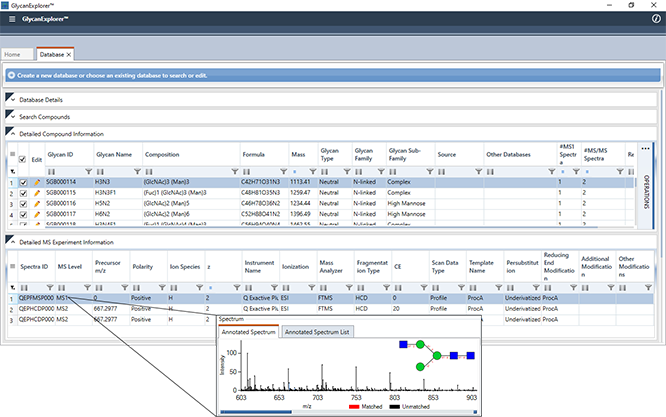
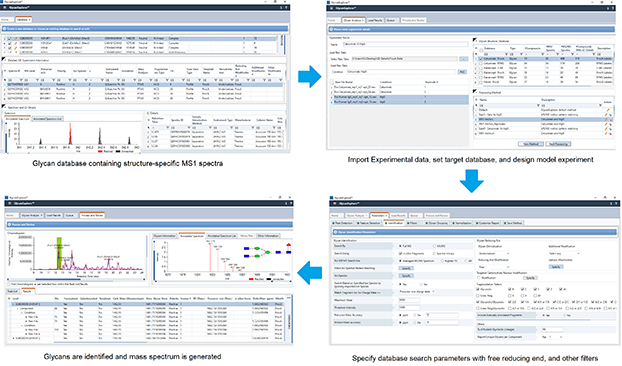
创建光谱库
除了内置数据库外,GlycanExplorer还允许您创建您感兴趣的聚糖的光谱数据库。您可以导入多个糖链结构,指定它们的实验细节,存储多个质谱(MS1和MS/MS)及其相关的色谱信息。为帮助您创建高分辨率糖链质谱库,该软件还允许您根据导入质谱的单个或多个参考离子校准前体和产物离子。可以按照以下快速步骤创建光谱数据库:
1. 在单个文本文件(示例KCF文件、示例序列文件)中收集构成聚糖结构的KCF(Kegg化学功能)内容/序列。
2. 指定数据库名称、描述并使用KCF/Sequence文件导入聚糖结构。
3. 指定仪器详细信息、聚糖特定实验详细信息(电离技术、碎片化技术、还原末端荧光团等)和样品入口详细信息(直接注入或分离)。
4. 导入多糖异性MS1和MS/MS谱图,指定离子种类信息,并通过与多糖特异性in-silico碎片匹配来注释光谱片段。
5. 一旦成功注释,光谱将被保存并进一步用作报告候选聚糖结构的参考光谱。
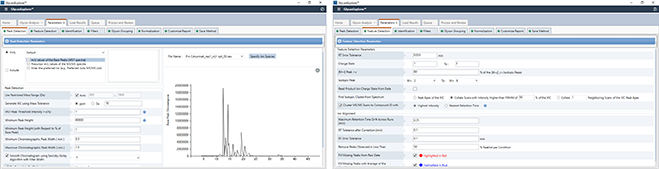
高效的LC-MS峰值拾取和校准
GlycanExplorer具有强且高效的LC-MS和LC-MS/MS数据处理算法,用于检测LC峰,并随后从原始数据中发现分子特征。该算法可以准确的检测LC化合物及其同位素包络线。该算法有助于准确分配前体m/z值和MS/MS扫描的电荷状态。它还使您能够提交质量列表以进行峰检测和挑选。此功能显著降低了复杂生物样品中低丰度化合物无法检测到LC峰的可能性。
如果您的目标生物样品有多个技术重复,GlycanExplorer允许您在指定的m/z和保留时间容差内将全部相应技术重复中的样品检测峰对齐。此功能可帮助您找到全部重复中普遍检测到的有效峰并丢弃不一致的峰。
主要特征:
1. 一种强的峰检测算法,具有可编辑的参数,例如m/z容差、降噪、峰宽、包括提交质量列表的工具。
2. 自动平滑和色谱解卷积。
3. 同位素包膜的识别。
4. 准确分配MS/MS光谱的前体m/z和电荷态。
5. 查看和导出不同的色谱图(总离子色谱图、提取离子色谱图、基峰色谱图)。
6. 灵活的MS/MS簇算法。
7. 使用用户指定的m/z和保留时间公差进行高效峰对齐。
可靠的高通量聚糖鉴定
GlycanExplorer支持多种糖链分析工作流程,帮助您有信心识别糖链结构。
-
使用来自实验MS1数据、离子种类和其他实验信息的化合物的准确质量,该软件可以可靠的预测候选聚糖结构。
-
该软件还可以通过将实验产物离子(来自MS/MS扫描)与其数据库中可用的聚糖特异性in-silico碎片匹配,准确预测候选聚糖结构。
-
借助内置或自定义创建的高分辨率准确质量(HRAM)糖链谱库,该软件允许您通过比较实验MS/MS谱图与参考谱图来识别可能的糖链。
-
该软件引入了一种特有的糖链结构报告机制,结合了in-silicp模拟和光谱模式匹配搜索方法的可信度。此工作流程先通过将实验MS/MS片段与聚糖特异性in-silico碎片匹配来识别候选聚糖,然后将这些实验光谱与HRAM参考光谱库进行比对。
主要特征:
1. 适应MS1和基于MS/MS的聚糖鉴定的工作流程,用于直接输注、LC、MALDI-MS/MS工作流程生成的数据。
2. 支持全部主要的还原端荧光团,如2-氨基苯甲酰胺(2-AB)、2-氨基苯甲酸(2-AA)、GlycanWorks RapiFluor-MS、普鲁卡因胺(ProcA)等。
3. 一次性分析多种离子组合的数据。
4. 为高可信度聚糖鉴定设置阈值分数的工具。
5. 多个过滤器以减少误报。
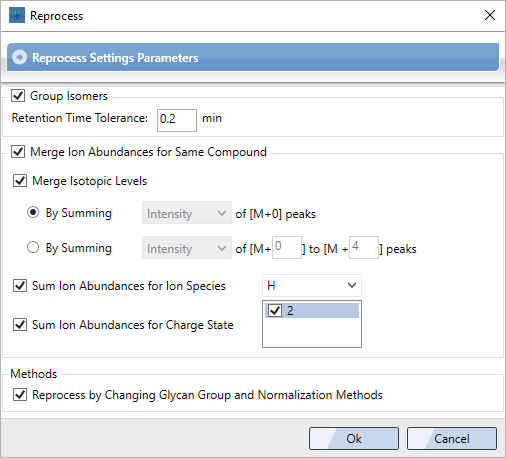
实时优化
在实验室研究中,实时优化对于纠正错误并在相当短的时间内实现预期输出是必要的。GlycanExplorer为您提供了使用一组优化的搜索条件(例如异构分组的保留时间容差、聚糖分组、标准化策略等)对数据集重新运作分析的功能,而不会覆盖先前分析的结果。因此,您可以分析在不同参数集下获得的结果,以快速得出有意义的推论。此外,GlycanExplorer允许您生成交互式图表和绘图以查看分析的输出,并优化适合您的数据的搜索参数。
主要特征:
1. 多个参数微调优化的搜索结果。
2. 交互式图表和绘图以查看参数。
3. 将优化后的参数集保存为新方法以备将来使用。
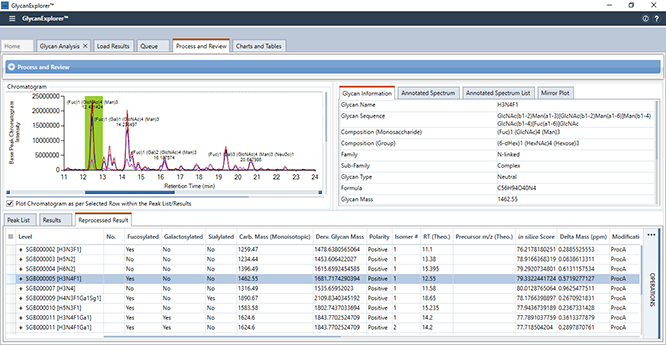
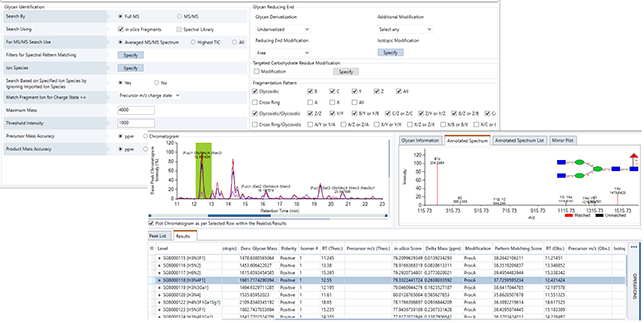
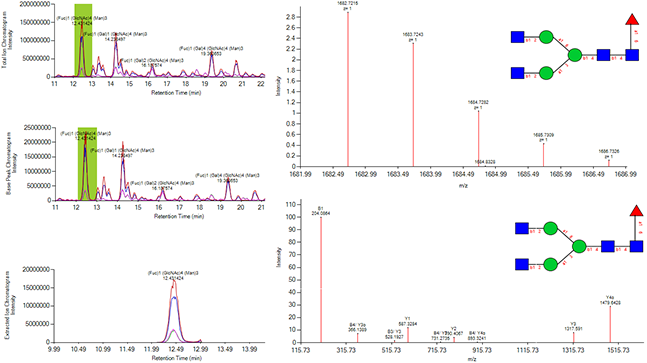
带注释的色谱图和质谱图
GlycanExplorer通过生成带注释的色谱图和光谱图帮助您查看数据。它显示全部三个色谱图,总离子色谱图(TIC)、基峰色谱图(BPC)、提取/选择离子色谱图(XIC/SIC),并标注了聚糖组成和保留时间。如果生物样品有多个技术重复,软件也会显示叠加色谱图。
为了直观的验证报告的候选聚糖结构的准确性,软件会显示带注释的质谱和镜像图。
GlycanExplorer有一个专用的Spectrum面板,可显示已识别聚糖的详细信息以及它们的实验色谱信息。
主要特征:
1. 带有明确定义的同位素体和聚糖结构的注释MS1谱图。
2. MS/MS谱图用特定结构的特征离子和聚糖结构进行注释。
3. 镜像图显示MS/MS光谱数据库搜索的效率。
4. 丰富的数据和显示参数生成您选择的色谱图或质谱图。
5. 显示详细的聚糖信息和相应的实验和色谱细节。
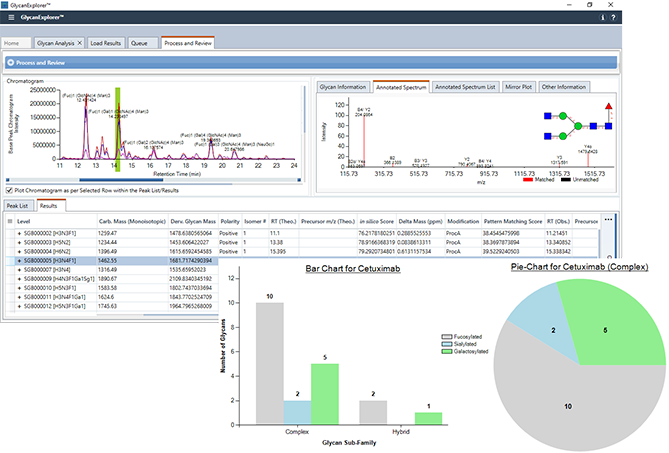
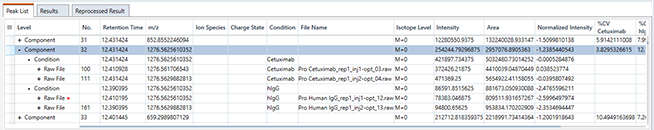
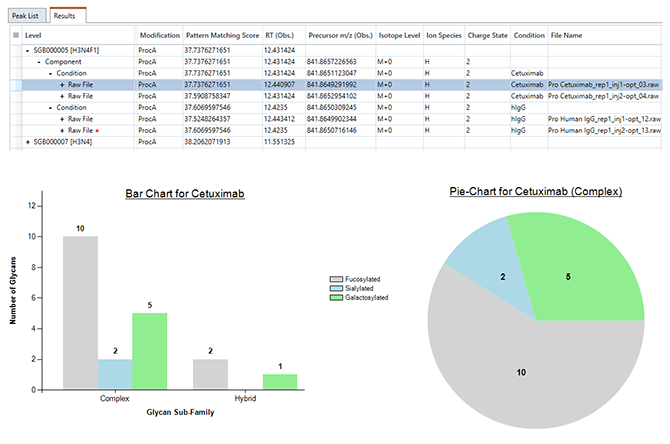
结果的显示和多糖图谱
GlycanExplorer提供分层数据组织模型。它显示对齐的峰列表,可以进一步逐步扩展以查看生物样本、它们的技术复制和相应的同位素体。该软件报告识别的聚糖结构及其成分。
对于每组搜索结果,该软件允许您微调参数并实时比较输出,帮助您找到适合您的样本数据的优化参数组。
该软件可生成频率表、离子丰度表、交互式条形图和饼图,覆盖您的数据。
主要特征:
1. 丰富的分层数据组织,可依次展开查看全部样本和重复信息。
2. 频率表和离子丰度表提供样品中聚糖的定量汇总。
3. 交互式条形图和饼图有助于可视化样品的聚糖谱。
GlycanExplorer工作流程:
使用MS1 Spectra对N-聚糖进行高通量分析
GlycanExplorer支持使用MS1光谱对衍生和天然(游离还原端)聚糖样品进行N-聚糖分析。支持的衍生方法是全甲基化和荧光团标记的还原末端修饰。作为先决条件,用户须创建包含精选N-聚糖结构的自定义数据库,保存实验信息(如仪器详细信息、电离技术、衍生化、还原末端荧光团),并存储特定结构的MS1光谱。
该软件接受实验前体质量、离子种类、还原末端荧光团信息作为输入,并在用户指定的质量容差内使用准确质量搜索报告候选聚糖结构。GlycanExplorer可在一次搜索运行中识别多个加合物组合的可能聚糖结构,从而节省重复分析所花费的时间。具有低delta质量的聚糖得分高,并分配给感兴趣的化合物。
数据库搜索完成后,软件会自动生成一个质谱,对已识别的LC化合物的每个同位素体进行注释。还可以生成包含已识别聚糖结构的便携式Microsoft Excel报告。
主要特征:
1. 高效的LC-MS峰检测和选择。
2. 详细的数据库搜索参数和过滤器。
3. 一次执行多个加合物组合的数据库搜索。
4. 显示带有注释的LC-化合物同位素体的MS1谱图。
5. 便携式Microsoft Excel报告生成。
使用MS/MS Spectra对N-聚糖进行高通量分析
GlycanExplorer可以使用MS/MS数据有效识别糖链,用于直接输注、LC-、MALDI-MS/MS工作流程生成的天然(游离还原端)和衍生糖链样品。支持的衍生方法是全甲基化和荧光团标记的还原末端修饰,例如2-氨基苯甲酰胺 (2-AB)、2-氨基苯甲酸 (2-AA)、GlycoWorks Rapi Fluor-MS、普鲁卡因酰胺 (ProcA) 等。该软件接受实验数据并生成候选峰列表(用于LC-MS和 MS/MS数据),进一步进行MS/MS数据库搜索以报告候选聚糖结构。可以导出搜索结果以及Microsoft Excel文件中的聚糖结构,以便于共享。
该软件适用于三种不同类型的MS/MS数据库搜索方法:
-
in-silico Fragment Matching:在这种搜索方法中,软件通过将实验产物离子与指定目标数据库中可用的聚糖特异性in-silico片段进行匹配来报告候选聚糖结构。
-
谱图匹配:借助内置或自定义创建的高分辨率准确质量 (HRAM) 糖链谱库,该软件允许您通过比较实验MS/MS谱图与参考谱图来识别可能的糖链在目标数据库中可用。
-
in-silico Fragment和Spectral Pattern匹配的组合:GlycanExplorer引入了一种特有的聚糖结构报告机制,结合了in-silico和光谱模式匹配搜索方法的可信度。工作流程识别候选聚糖,先通过将实验MS/MS片段与聚糖特异性in-silico片段匹配,然后将这些实验光谱(报告具有高于指定阈值的in-silico方法的聚糖结构)与HRAM参考光谱库。
主要特征:
1. 导入Thermo Scientific原生 .raw 文件格式并分配样本和重复。
2. 高效的LC-MS峰检测和选择。
3. 用于指定详细数据库搜索参数和过滤器的专用窗口。
4. 可以一次性使用多个加合物组合进行数据库搜索。
5. 显示带注释的MS/MS谱图以及糖链结构。
6. 便携式Microsoft Excel报告生成。
系统要求:
| 对于Windows | 需要 | 推荐 |
| CPU | Intel Core i5 | i5 / i7 |
| 系统类型 | 64位 | 64位 |
| 内存 | 16GB或更高 | 32GB |
| 硬盘空间 | 1TB | 1TB或更高 |
Windows 支持的平台:Windows 7/Windows 8/Windows 10/Windows 11
【英文介绍】
GlycanExplorer is a one-stop software solution for bio-therapeutic glycan characterization and quantification. With pre-loaded high-resolution accurate glycan spectral databases, the software allows you to identify probable glycan structures with unparalleled confidence. Extensive and comprehensive data organization along with interactive charts and plots facilitates achieving detailed profiling of glycan samples, which further helps in drawing meaningful biological conclusions.
GlycanExplorer Features
High-Resolution Accurate-Mass (HRAM) Glycan Spectral Library
GlycanExplorer accommodates built-in HRAM glycan spectral libraries from various therapeutic glycproteins labeled with fluorophores such as 2-aminobenzamide (2-AB), RapiFluor-MS, Procainamide (ProcA) etc.
The software accommodates spectral libraries of various monoclonal antibody (mAb) variants (Cetuximab, Ipilimumab, Infliximab, Pertuzumab, Golimumab, Nivolumab, and NIST mAb) and other glycoproteins such as Apotransferrin, Orosomucoid, Ovalbumin, RNaseB etc.
Efficient LC-MS Peak Picking and Alignment
GlycanExplorer has a robust and efficient LC-MS and LC-MS/MS data processing algorithm for detecting LC peaks, and subsequent molecular feature finding from the raw data. The algorithm accurately detects LC-compounds along with their isotope envelopes. The algorithm helps in accurate assignment of precursor m/z values and the charge states for the MS/MS scans. It also enables you to submit a preferred mass list for peak detection and picking. This functionality significantly reduces the likelihood of LC-peaks not being detected for low abundant compounds in complex biological samples.
If you have multiple technical replicates of your biological sample(s) of interest, GlycanExplorer allows you to align the detected peaks of a sample across all corresponding technical replicates within a specified m/z and retention time tolerance. This functionality helps you find valid peaks which are universally detected across all replicates and discard inconsistent peaks.
Confident High-Throughput Glycan Identification
GlycanExplorer accommodates multiple glycan analysis workflows to help you identify the glycan structures with unparalleled confidence.
-
Using the exact mass of a compound from the experimental MS1 data, the ion species, and other experimental information, the software can predict the candidate glycan structures with confidence.
-
The software can also predict the candidate glycan structures accurately by matching the experimental product ions (from MS/MS scans) with glycan specific in-silico fragments available within its database(s).
-
With the help of built-in or custom created High-Resolution Accurate-Mass (HRAM) glycan spectral libraries, the software allows you to identify probable glycans by comparing the experimental MS/MS spectral pattern with that of the reference spectra.
-
The software brings in a unique mechanism of reporting glycan structures that combines the confidence of both in-silico and spectral pattern matching search methods. This workflow identifies the candidate glycans, first by matching the experimental MS/MS fragments with the glycan specific in-silico fragments, then by aligning those experimental spectra against the HRAM reference spectral libraries.
Real-time optimization
Real-time optimization is indispensable in the laboratory studies to correct errors, and achieve the expected output in a considerably lesser time. GlycanExplorer offers the functionality for you to rerun an analysis over a dataset with a set of optimized search criteria such as, retention time tolerance for isomeric grouping, glycan grouping, normalization strategies etc., without overwriting the results of the previous analysis. You can therefore analyze the results obtained under different sets of parameters to quickly draw meaningful inferences. Additionally, GlycanExplorer allows you to generate interactive charts and plots to review the output of an analysis, and to optimize the search parameters best suited for your data.
Annotated Chromatogram and Mass Spectrum
GlycanExplorer helps you see through your data by generating annotated Chromatogram and Spectrum plots. It displays all three chromatograms, Total ion Chromatogram (TIC), Base Peak Chromatogram (BPC), Extracted/Selected ion Chromatogram (XIC/SIC) annotated with glycan composition and retention time. If there are multiple technical replicates of the biological samples, the software displays overlaid chromatogram plots as well.
To visually verify the accuracy of the reported candidate glycan structures, annotated mass spectra and Mirror plot are displayed by the software.
GlycanExplorer has a dedicated Spectrum panel that displays detailed information of the identified glycans along with their experimental and chromatographic information.
Comprehensive Result Display and Glycan Mapping
GlycanExplorer accommodates a comprehensive hierarchical data organization model. It displays the aligned peak lists which can be further expanded stepwise to view the biological samples, their technical replicates, and the corresponding isotopologues. The software reports the uniquely identified glycan structures, along with their components.
For every set of search results, the software allows you to fine-tune the parameters minutely and compare the output in real time helping you to find the optimized parameter set for your sample data.
The software generates Frequency table, ion Abundance table, interactive bar charts, and pie charts that gives a complete coverage of your data.


- 2026-07-29
- 2026-07-28
- 2026-07-26
- 2026-07-24
- 2026-07-23
- 2026-07-21

- 2026-07-30
- 2026-07-29
- 2026-07-29
- 2026-07-29
- 2026-07-29
- 2026-07-29